Labor Market Information Dashboard
A customized data set exploring both industry and occupations
While we have been collecting data on businesses and their industries in Indiana for many years, we did not start collecting occupation information until 2019. This means that we were able to tell if a person was working in the health care industry, but we did not have data on whether that person was employed as a nurse or a cook. Now with the occupation information, we will be able to better analyze the staffing patterns, and also better understand the workforce and education ecosystem (for example, by exploring how many working Hoosiers are underemployed, which occupations are typically filled by history majors, and what are the wage gains by occupation within the major of study).
This dashboard contains regional and state information on:
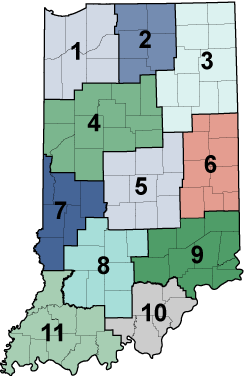
Use the map below to view insights from your local regional analyst

 Hoosiers by the Numbers