 Hoosiers by the Numbers
Local Employment Dynamics (LED)
Local Employment Dynamics (LED) is a voluntary partnership between state labor market information agencies and the U.S. Census Bureau to develop new information about local labor market conditions at low cost, with no added respondent burden, and with the same confidentiality protections afforded by census and survey data.
Source: U.S. Census Bureau, Local Employment Dynamics
Frequently Asked Questions
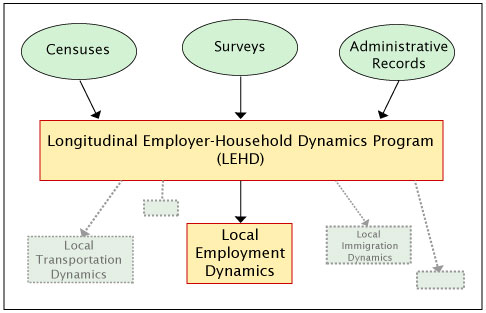
- What is the difference between LEHD and LED?
Longitudinal Employer-Household Dynamics (LEHD) is an innovative program within the U.S. Census Bureau that combines federal and state administrative data on employers and employees with core Census Bureau censuses and surveys while protecting the confidentiality of people and firms that provide the data. Local Employment Dynamics (LED) is a subset of this program.
-
What does LED provide?
- Time sensitive and historical demographic information
- Locations of industries
- Listing of industries prone to hiring
- Demographic monthly salary figures
- Worker characteristics by industry, gender, and age
- Economic trends by worker’s age and sex; by state, county, WSA and MSA
- What are some examples of Local Employment Dynamics used by decision makers?
- Measurement of Worker Turnover
- Workers identifying the likely duration of employment
- Management benchmarking turnover rates within an industry
- State and local agencies measuring workforce quality
- Workers identifying the likely duration of employment
- Worker’s Wages in an Industry by Geography
- Employers knowing what workers are being paid and how much to pay new hires
- Workers knowing what wages they may expect to earn in a particular industry
- Placement agencies recognizing what jobs in different industries are likely to pay
- Education institutions measuring wage performances
- Employers knowing what workers are being paid and how much to pay new hires
- Concentration of Workforce by Industry
- Transportation planners deciding where new roads and public transportation should be located.
- Measurement of Worker Turnover
- What are the Quarterly Workforce Indicators (QWI)?
The Quarterly Workforce Indicators (QWI) are a set of economic indicators—including employment, job creation, wages, and worker turnover—that can be queried by different levels of geography—state, county, metro, and workforce investment area—as well as by detailed industry, gender, and age of workers. - Why aren’t QWI data available for all states?
QWI data are available for all states that are LED-state partners; however, not every state is currently a LED-state partner. View list of LED state partners. - What types of employment are included in the QWI?
The QWI are built upon wage records in the Unemployment Insurance (UI) system and information from state QCEW data. The universe of QWI data is UI-covered earnings. UI coverage is broad, covering over 90 percent of total wage and salary civilian jobs.
When QWI private industry employment numbers are compared with other employment data, exclusions to UI coverage should be taken into account. Federal government employment is not generally included. Exempted employment varies slightly from state to state due to variations in state unemployment laws, but generally also excludes many farmers and agricultural employees, domestic workers, self-employed non-agricultural workers, members of the armed forces, some state and local government employees as well as certain types of nonprofit employers and religious organizations (which are given a choice of coverage or noncoverage in a number of states).
A more in-depth discussion of UI-coverage issues is available in the technical paper "Employment that is not covered by state unemployment" (PDF). - Is there a data dictionary available for the QWI?
Definitions for the variables on QWI Online can be found by selecting the button next to the variable. View a brief overview of the complete list of QWI variables (PDF).
 - Can I download all the QWI data for a county from the website?
You can download the 8 indicators that are available on the website using the following steps:- After you have chosen the county that you are interested in, click on "View Detailed Comparison Reports" at the bottom of the screen.
- You will then see a second table that shows three selection fields: Pivot column, data rows, and years. To select all fields, hit shift and left mouse button when you’re in the data row selection field. To select some, but not all fields, hit ctrl and left mouse button when selecting the fields that you want. The same holds for years. You can choose only one age/sex/age group or year to display on the pivot table.
- Once you’ve selected the fields you want, click on the download dataset option to the top left of the table.